
Can the Numbers Tell Us What’s Up With Roberto Osuna?
Photo credit: Kim Klement-USA TODAY Sports

Sep 6, 2017, 14:58 EDT
In 2017, Roberto Osuna has struck out batters at a higher rate, walked them at a lower rate, and been less prone to home runs than any season of his short but so-far magnificent career. And yet here he is, in the middle of a mini “closer controversy” — or at least having to be defended by his G.M., who in a radio hit today insisted that the club won’t demote their closer, despite Osuna having picked up his league-high 10th blown save of the season on Tuesday night.
How can this be?
Well, mostly it’s because his outstanding rate stats this season say nothing of how Osuna’s pitched from game to game, or, specifically, over this funky stretch he seems to have entered. Looked at on a more granular level and some trends not so easily explained away by “look at those rate stats, he’s fine!” seem to emerge.
Part of what makes Osuna’s season look so great is the fact that he was utterly untouchable for a huge stretch of it. Just before the All-Star break, Jeff Sullivan of FanGraphs wrote a piece titled Roberto Osuna Is Just About Perfect, and nobody batted an eye.
He was! After coming back from the World Baseball Classic with a stiff neck, Osuna began the season struggling a little, but by the end of April he’d clearly got himself right. From April 29th to July 27th he threw 36.1 innings, walking just four batters, allowing just four runs, one home run, and striking out 52. His strikeout rate over that stretch was a ridiculous 40.3%, his swinging strike rate was 20.5%, and his ERA was 0.99. For the season, though, his strikeout rate is just 32.5%, his swinging strike rate is at 17.2%, and his ERA is 3.66. Outside of that long, incredible stretch, he’s dragged those numbers down by being quite a bit closer to ordinary — or at least as close to ordinary as an incredible pitcher like Osuna can be.
Now, granted, we can play this arbitrary endpoints game with just about any pitcher. Of course if we look at a sample that starts with his first clean inning after a rocky couple of weeks in April, and ends with his last clean inning before the wheels started to come off in late July, it’s going to paint a picture that is a little bit skewed — and provide us with a good reminder that in this game nothing is ever quite as good or quite as bad as it seems. Still, though, even understanding that, it’s pretty easy to see that his brilliance hasn’t yet returned.
Over 16.2 innings since July 29th, Osuna has pitched to an 8.10 ERA. He’s not been that bad, but he’s struck out just 18 batters over that stretch, walked five, allowed 20 hits, one home run, and 17 runs (15 of which were earned). Rate-wise, he’s struck out just 22.8% of the batters he’s faced, walked 6.3%, and his swinging strike rate has been just 13.6%.
Those are some decent peripherals, actually. Osuna’s career strikeout rate is 29.4%, his walk rate is 4.9%, and his swinging strike rate is 15.5%. In those terms, the awful, 8.10 ERA stretch doesn’t look a whole lot worse than exactly what you’d expect from Osuna. Certainly he’s been a little bit unlucky, then? And is actually totally fine?
That would be an easy explanation if there wasn’t more still to the statistical story.
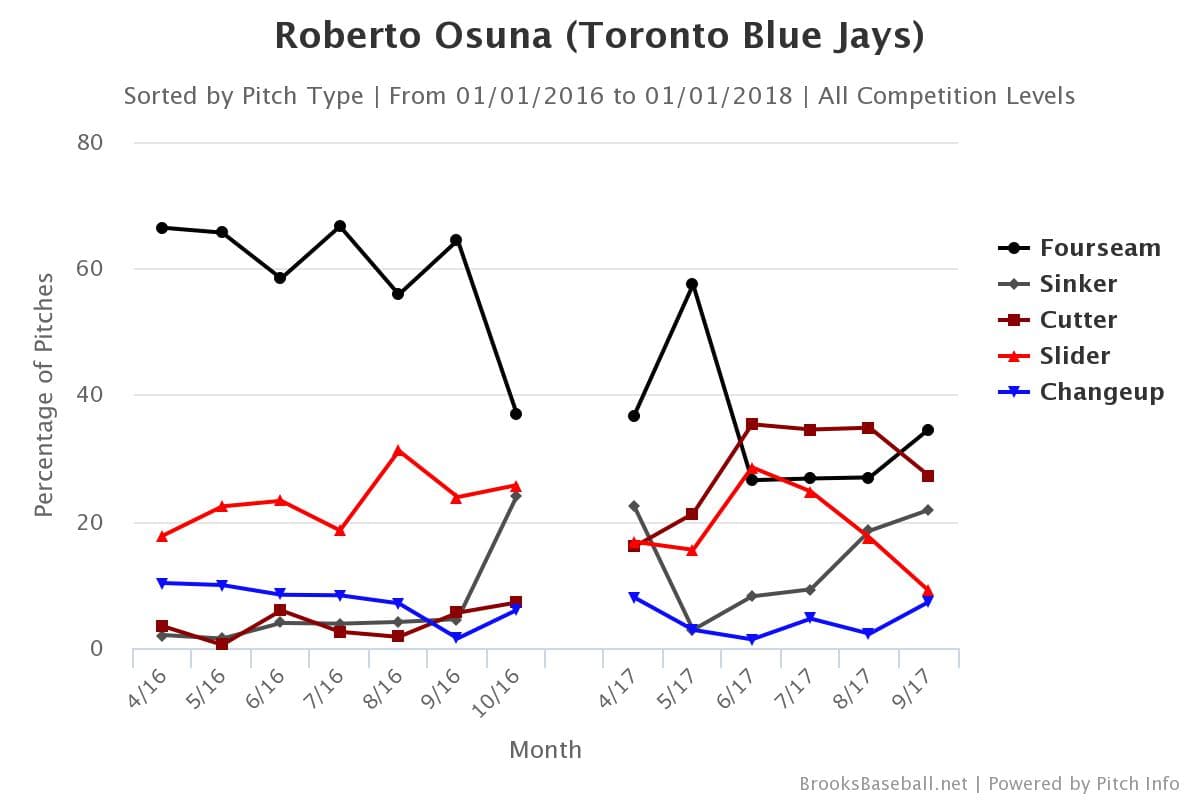
For example: For his career Osuna has thrown 44.8% of his pitches in the strike zone. Over the recent stretch that rate has been just 36.1%. That seems kinda significant! And I think that anybody who has been watching will probably tell you that the numbers ring true, and that it hasn’t so much looked like it was by design, but because he’s been fighting his command at times. Anecdotally, I might claim that because the stuff is so good he’s still generating swing and miss, even if he’s throwing sliders in the dirt or the other batter’s box — and because he’s gone so conspicuously away from his four-seamer, especially as compared to previous years, as we can see here (keep in mind that the September 2017 sample is still very small):
Then, of course, there’s this:
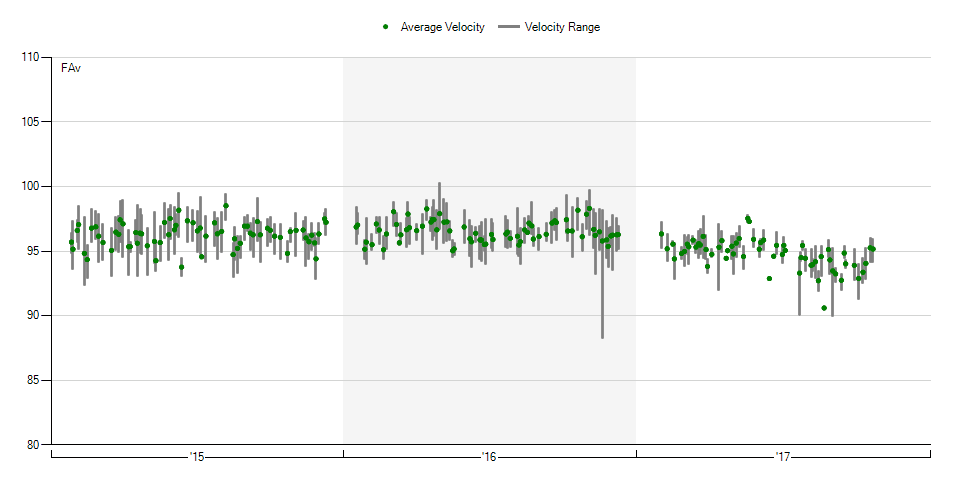
Granted, I’ve used the FanGraphs version of his velocity chart, rather than the one from Brooks, because it looks just a little bit more stark, but either way it’s clear that something has gone on with his velocity. Like, what, two-thirds of the career appearances where his average velocity has been below 95 have come in the second half of 2017?
While, on a positive note, it seems to have started to tick back up over his last few outings (also: velocity doesn’t last forever for anybody), it still isn’t great. And, more importantly, the results haven’t followed.
Yes, some of that bloated ERA is due to luck, and there are a whole bunch of clean innings and fine efforts that have come over this stretch that we tend to gloss over. But something is definitely amiss.
If you came here expecting answers to the big questions that follow — what, specifically, is wrong, and how easily can it be fixed — I don’t have good news for you. Because I have no idea!
It wasn’t so long ago that Osuna was “just about perfect,” and doing so with a pitch mix, and with velocities — at least for a significant stretch — that don’t look so different. In fact, his percentage of pitches in the zone during his incredible stretch was 38.6% — much closer to the bad recent times than his career norm.
So… ¯\_(ツ)_/¯
Which is to say, it’s certainly not as bad as it feels, and it might not even be bad at all, but that there are clearly things to be monitored here. Perhaps Osuna is just grappling with a new normal, as far as his stuff goes, and is simply in an adjustment period. Perhaps the grind of the last two seasons and their high workload (in relief terms) have started to catch up with him.
For now, there are more questions than answers. That’s not a great feeling to have about such a vital piece of your bullpen! But at least we can’t see anything yet that’s pointing us in the direction that he’s anywhere near irrevocably fucked, I suppose. We can take solace in that.
Breaking News
- June 3 Gameday: Blue Jays look to avoid series loss against Braves
- Blue Jays: Louis Varland has cemented himself among MLB’s best relievers
- Blue Jays: Examining Yohendrick Piñango’s rise to prominence
- Former Twins reliever Justin Topa signs minors deal with Blue Jays
- Mason Fluharty has been a workhorse for Blue Jays’ bullpen this season