logo

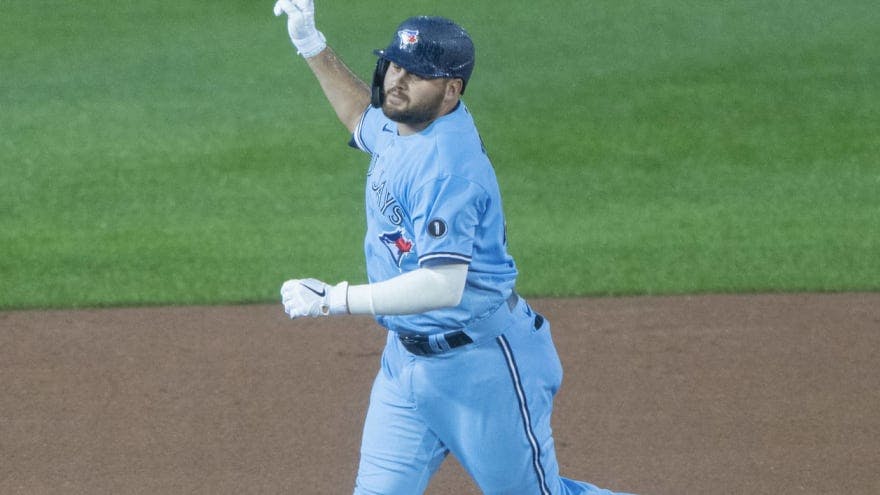
How real was the Rowdy Tellez Breakout?

alt
Paul Berthelot
3 years ago
The Blue Jays are ready to contend.
They have reached the point of their re-build (if you can even call it that) where it’s time to put up or shut up. They can’t afford to keep waiting on players and hope for something to click, they need production now. With that being said this team is far from perfect. The roster still has plenty of questions marks. Can Vlad Guerrero Jr. handle third base? What’s the best position for Cavan Biggio? Will Alejandro Kirk continue to hit over a full season?
One question that might have an answer is how real was the Rowdy Tellez breakout?
Rowdy was fantastic in 2020. In 35 games he hit .283/.346/.540 good for a 136 wRC+. He hit eight home runs increased his walk rate to 8.7% and most impressively cut his strikeout rate basically in half down to 15.7%. He was one of the Blue Jays best hitters and it was a real shame to see him down go down with a knee injury in September. He missed most of the month but at least was able to get back and have a plate appearance in the postseason.
Rowdy has always had big power but it came with a low contact high strikeout approach. That all changed this season thanks in part to new assistant hitting coach Dante Bichette. Rowdy moved away from that all power all the time approach focusing more on getting the bat on the ball. He cut his swing down, as he said in this quote from Laura Armstrong of the Star.
“Now it’s trust myself, be a good hitter, use the whole field,” Tellez said before Monday’s game. “Anything can happen … funky hops through the infield, bleeders, jammed shots, find barrels. Anything can happen if you cut (your swing) down and just trust yourself.”
Rowdy increased his contract rate to 78.7% and cut his swinging strike rate down to 10.6%. Impressively Rowdy was able to do this without a drastic change to his swing patterns.
O-SwingZ-SwingO-ContactZ-ContactSwStr%GB%
201837.2%64.3%51.7%86.1%14.2%38.0%
201939.3%64.9%59.8%81.1%14.4%38.5%
202037.3%69.6%66.0%89.3%10.6%46.3%
As you can see this approach helped Rowdy make more contact, particularly on pitches out of the strike zone. This is a good approach for a player like Tellez to be taking. He is so strong that even if he gets a ball off the hands he can still muscle it over the infield, and that is going to lead to more of those flare/burner hits. There will also be more groundballs which as a lefty power hitter isn’t ideal. A lot of those groundballs will end up in the shift for easy outs. Right now though this isn’t too concerning, there are plenty of slow-footed power hitters who hit the balls on the ground ~45% of the time who are successful.
So how much of this is believable and how much is just small sample noise?
Rowdy had 127 plate appearances and 95 balls in play. There are certain stats that will stabilize in that short of time. Per the Fangraphs Library on Sample Size, swing rate stabilizes at 50 plate appearances, strikeout rate at 60, contact rate at 100, and walk rate at 120. So we can expect Rowdy’s new approach at the plate to continue next season. The strides he made with his strikeout rate weren’t a fluke. He may not be a 15% strikeout rate player long term but he may settle in at 21-22%, which is still a major improvement from where he was.
So how do we project Rowdy going forward?
For starters Rowdy’s success last season wasn’t due to those flares and burners dropping for hits. Rowdy’s batting average on balls in play was a very reasonable .276. This isn’t September 2018 where Rowdy had a .391 BABIP as everything was dropping.
Let’s take a look at what the project systems say. All courtesy of Fangraphs.
AVGOBPSLGOPSBABIPBB%K%
ZIPS.261.324.500.824.2937.8%22.9%
Steamer.258.329.478.808.2978.6%23.7%
THE BAT.251.321.470.791.2818.4%22.6%
THE BAT X.253.323.477.800.2818.5%22.6%
All four projection systems are pretty well in agreement. They see Rowdy keeping some of the gains he made in strikeout and walk rate. They all see him right around an .800 OPS with the exception of ZIPS which believes in his power more than the others.
These projections provide a solid baseline of what to expect from Tellez next season. Projections though aren’t perfect and one way players can beat their projections is by hitting the ball really hard. Rob Arthur of The Athletic wrote back in 2018 “for every mile per hour above 108, a hitter is projected to gain about 6 points of OPS relative to their projected number.”
Entering last season Tellez was projected by ZIPS to have a .753 OPS. His max exit velocity on the season was this 117.4 mph blast off Vince Velasquez.
We take the nine mile per hour difference between 117, and 108, multiply that by six, giving Rowdy an additional 0.56 points of OPS. Adding that to his ZIPS projections bumps him up to an .809 OPS which is right in line with where the projections have him for this season.
(Edit: This section has been changed as the previous iteration included all balls hit over 108 mph, which was incorrect. For projecting OPS just the highest velocity batted ball should be used)  
Looking ahead to 2021 the Rowdy Tellez question could be answered. He already projects as a top 10 first basemen, by Fangraphs Depth Charts, and there is upside beyond that. He had a breakout 2020 season and while we can’t believe everything we saw, some of the changes he made are more than small sample flukes. Rowdy still has to prove he can do it for a full season, but if he shows the same approach at the plate and smashes a ball early in the season, he could beat his projections once again.

Check out these posts...