
How have Toronto Blue Jays hitters and pitchers fared at Coors Field in the past?
Photo credit: Isaiah J. Downing-USA TODAY Sports

By Zach Laing
Sep 1, 2023, 16:40 EDT
The Toronto Blue Jays will be taking their talents to Denver, Colorado’s Coors Field for a three-game set this weekend.
And when it comes to the sport of baseball, elevation really plays a difference in what happens with the ball. With Coors Field nestled right in the heart of the Rocky Mountains, the elevation sits at 5,200 feet above sea level — far and away the stadium with the highest elevation nearly five times higher than that of the Arizona Diamondbacks’ Chase Field.
Coors Field has built a reputation around baseball for being the league’s most hitter-friendly park since it opened in 1995. That elevation causes the ball to travel through the air easier allowing longer hits. For power hitters, this is their dream. For pitchers, however, it’s their nightmare as that thin air causes breaking balls to break less, offering hitters meatballs at a much higher rate.
Here, for example, is a few statistics looking at the difference in numbers.
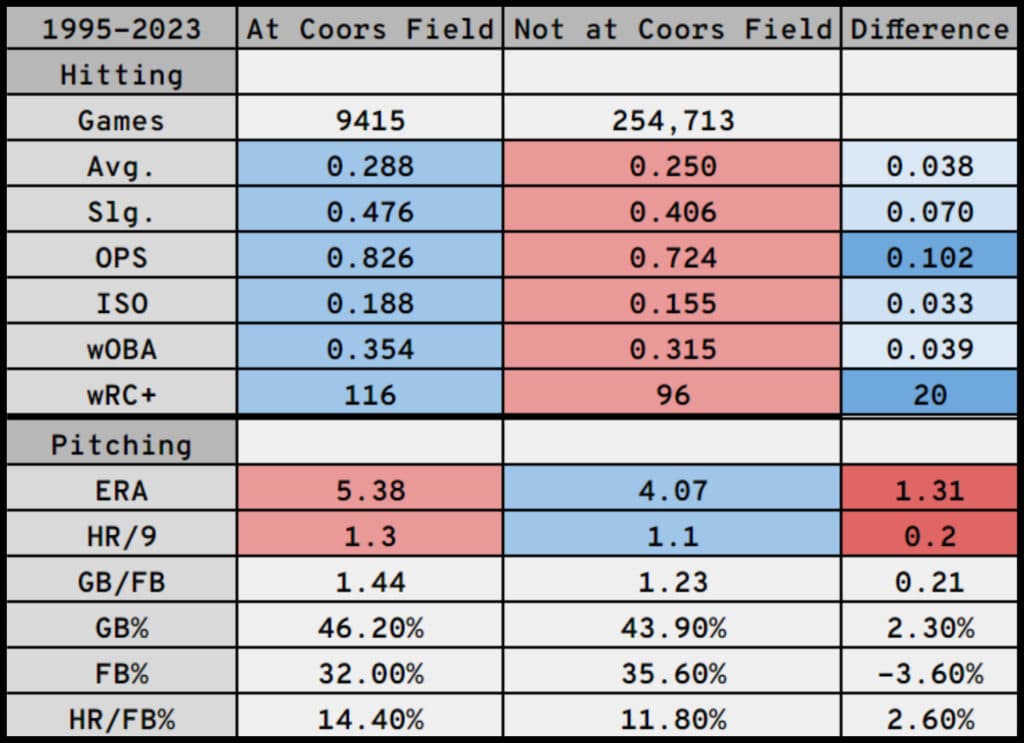
As noted above, hitters have a blast at Coors Field with numerous key offensive numbers rising — most significantly, their slugging percentage and OPS. Their weighted runs created plus, which takes runs created statistics and accounts for external factors — such as ballparks — skyrockets 20 percent.
Pitchers, meanwhile, see their ERAs plummet from 4.07 to 5.38, while allowing 18 percent more home runs. The batted ball numbers are interesting, too, showing that pitchers are making it a point to induce as many groundballs as possible and limit their flyballs. Can you blame them?
These numbers aside, it got me thinking — how have the Toronto Blue Jays players historically fared at Coors Field? Below is a list of the Jays’ players and their splits in Colorado, and outside of Colorado over the course of their MLB careers, in order from most career at-bats, to least.
Brandon Belt | AB | HR | HR/AB | Avg. | Slg. | OPS | ISO | wOBA | wRC+ |
At Coors Field | 293 | 16 | 18.3 | 0.317 | 0.563 | 0.938 | 0.246 | 0.398 | 155 |
Not at Coors Field | 4241 | 168 | 25.2 | 0.257 | 0.452 | 0.807 | 0.195 | 0.348 | 122 |
At vs away | -6.9 | 0.060 | 0.111 | 0.131 | 0.051 | 0.050 | 33 |
George Springer | AB | HR | HR/AB | Avg. | Slg. | OPS | ISO | wOBA | wRC+ |
At Coors Field | 37 | 2 | 18.5 | 0.324 | 0.541 | 0.883 | 0.216 | 0.374 | 141 |
Not at Coors Field | 4097 | 225 | 18.2 | 0.267 | 0.486 | 0.842 | 0.219 | 0.361 | 132 |
At vs away | 0.3 | 0.057 | 0.055 | 0.041 | -0.003 | 0.013 | 9 |
Whit Merrifield | AB | HR | HR/AB | Avg. | Slg. | OPS | ISO | wOBA | wRC+ |
at Coors Field | 14 | 1 | 14.0 | 0.357 | 0.571 | 0.905 | 0.214 | 0.374 | 143 |
Not at Coors Field | 3837 | 84 | 45.7 | 0.285 | 0.425 | 0.756 | 0.140 | 0.324 | 102 |
At vs way | -31.7 | 0.072 | 0.146 | 0.149 | 0.074 | 0.050 | 41 |
Matt Chapman | AB | HR | HR/AB | Avg. | Slg. | OPS | ISO | wOBA | wRC+ |
at Coors Field | 21 | 1 | 21.0 | 0.333 | 0.571 | 0.956 | 0.238 | 0.389 | 154 |
Not at Coors Field | 2836 | 145 | 19.6 | 0.243 | 0.467 | 0.796 | 0.224 | 0.340 | 119 |
At vs way | 1.4 | 0.090 | 0.104 | 0.160 | 0.014 | 0.049 | 35 |
Vladimir Guerrero Jr. | AB | HR | HR/AB | Avg. | Slg. | OPS | ISO | wOBA | wRC+ |
at Coors Field | 12 | 1 | 12.0 | 0.417 | 0.833 | 1.295 | 0.417 | 0.523 | 237 |
Not at Coors Field | 2159 | 115 | 18.8 | 0.285 | 0.502 | 0.859 | 0.217 | 0.366 | 134 |
At vs way | -6.8 | 0.132 | 0.331 | 0.436 | 0.200 | 0.157 | 103 |
Bo Bichette | AB | HR | HR/AB | Avg. | Slg. | OPS | ISO | wOBA | wRC+ |
at Coors Field | #N/A | #N/A | #N/A | #N/A | #N/A | #N/A | #N/A | #N/A | #N/A |
Not at Coors Field | 1845 | 78 | 23.7 | 0.301 | 0.495 | 0.838 | 0.194 | 0.358 | 129 |
At vs way | #N/A | #N/A | #N/A | #N/A | #N/A | #N/A | #N/A |
Cavan Biggio | AB | HR | HR/AB | Avg. | Slg. | OPS | ISO | wOBA | wRC+ |
at Coors Field | 9 | 0 | 0 | 0.222 | 0.222 | 0.639 | 0.000 | 0.318 | 98 |
Not at Coors Field | 1187 | 42 | 28.3 | 0.227 | 0.394 | 0.734 | 0.168 | 0.323 | 103 |
At vs way | 0 | -0.005 | -0.172 | -0.095 | -0.168 | -0.005 | -5 |
Danny Jansen | AB | HR | HR/AB | Avg. | Slg. | OPS | ISO | wOBA | wRC+ |
at Coors Field | 3 | 0 | 0 | 0.333 | 0.667 | 1.167 | 0.333 | 0.477 | 205 |
Not at Coors Field | 1078 | 55 | 19.6 | 0.221 | 0.423 | 0.726 | 0.202 | 0.313 | 97 |
At vs way | 0 | 0.112 | 0.244 | 0.441 | 0.131 | 0.164 | 108 |
Daulton Varsho | AB | HR | HR/AB | Avg. | Slg. | OPS | ISO | wOBA | wRC+ |
at Coors Field | 46 | 4 | 11.5 | 0.283 | 0.652 | 1.005 | 0.370 | 0.418 | 168 |
Not at Coors Field | 1091 | 47 | 23.2 | 0.238 | 0.431 | 0.737 | 0.192 | 0.318 | 101 |
At vs way | -11.7 | 0.045 | 0.221 | 0.268 | 0.178 | 0.100 | 67 |
Alejandro Kirk | AB | HR | HR/AB | Avg. | Slg. | OPS | ISO | wOBA | wRC+ |
at Coors Field | #N/A | #N/A | #N/A | #N/A | #N/A | #N/A | #N/A | #N/A | #N/A |
Not at Coors Field | 797 | 23 | 34.7 | 0.267 | 0.395 | 0.750 | 0.128 | 0.331 | 114 |
At vs way | #N/A | #N/A | #N/A | #N/A | #N/A | #N/A | #N/A |
Santiago Espinal | AB | HR | HR/AB | Avg. | Slg. | OPS | ISO | wOBA | wRC+ |
at Coors Field | #N/A | #N/A | #N/A | #N/A | #N/A | #N/A | #N/A | #N/A | #N/A |
Not at Coors Field | 807 | 10 | 80.7 | 0.271 | 0.366 | 0.697 | 0.094 | 0.308 | 97 |
At vs way | #N/A | #N/A | #N/A | #N/A | #N/A | #N/A | #N/A |
Ernie Clement | AB | HR | HR/AB | Avg. | Slg. | OPS | ISO | wOBA | wRC+ |
at Coors Field | 3 | 0 | 0 | 0.000 | 0.000 | 0.400 | 0.000 | 0.275 | 80 |
Not at Coors Field | 286 | 3 | 95.3 | 0.210 | 0.269 | 0.529 | 0.059 | 0.238 | 51 |
At vs way | 0 | -0.210 | -0.269 | -0.129 | -0.059 | 0.037 | 29 |
Davis Schneider | AB | HR | HR/AB | Avg. | Slg. | OPS | ISO | wOBA | wRC+ |
at Coors Field | #N/A | #N/A | #N/A | #N/A | #N/A | #N/A | #N/A | #N/A | #N/A |
Not at Coors Field | 26 | 3 | 8.7 | 0.385 | 0.731 | 1.215 | 0.346 | 0.506 | 232 |
At vs way | #N/A | #N/A | #N/A | #N/A | #N/A | #N/A | #N/A |
Spencer Horwitz | AB | HR | HR/AB | Avg. | Slg. | OPS | ISO | wOBA | wRC+ |
at Coors Field | #N/A | #N/A | #N/A | #N/A | #N/A | #N/A | #N/A | #N/A | #N/A |
Not at Coors Field | 8 | 0 | 0 | 0.250 | 0.250 | 0.650 | 0.000 | 0.316 | 100 |
At vs way | #N/A | #N/A | #N/A | #N/A | #N/A | #N/A | #N/A |
There’s nobody on the Jays who sees more success at Coors Field than that of Vladimir Guerrero Jr.. His wRC+ climbs a staggering 103 points there with his OPS rising from .859 to 1.295. He is, quite simply, unstoppable there.
Another notable player with a big increase there is Daulton Varsho, whose 46 at-bats at Coors Field are the second most among Blue Jays next to Brandon Belt. Varsho sees his wRC+ climb 67 points with his OPS rising from .737 to 1.005. A big series from him would be great.
Speaking of Belt, who is considering retirement at the end of this season, he’s also seen a nice jump in his numbers over a significant sample size of 293 at-bats, far and away the most of any Jays player. That makes sense given his entire career before joining Toronto was spent in the NL East.
His wRC+ climbs 33 points at Coors Field, which is as significant as the other two players mentioned above given it’s over a much larger sample size.
This weekend the Jays will roll out Hyun-Jin Ryu Friday, Yusei Kikuchi on Saturday, and Kevin Gausman on Sunday with the first and last of the trio having prior experience at Coors.
Kevin Gausman | IP | ERA | HR/9 | GB/FB | GB% | FB% | HR/FB% |
At Coors Field | 23.1 | 3.47 | 2.3 | 0.830 | 36.40% | 43.60% | 25.00% |
Not at Coors field | 1398.0 | 3.91 | 1.1 | 1.200 | 42.60% | 35.40% | 12.40% |
At vs away | -0.44 | 1.2 | -0.370 | -0.062 | 0.082 | 0.126 |
Hyun-Jin Ryu | IP | ERA | HR/9 | GB/FB | GB% | FB% | HR/FB% |
At Coors Field | 26.2 | 7.09 | 2.7 | 1.060 | 39.20% | 37.10% | 22.20% |
Not at Coors field | 980.2 | 3.15 | 0.9 | 1.610 | 48.60% | 30.30% | 11.60% |
At vs away | 3.94 | 1.8 | -0.550 | -0.094 | 0.068 | 0.106 |
While the sample size is small, it’s interesting to see Gausman’s ERA dip, but his batted ball numbers move in directions opposite from what you would want at Coors. Ryu, meanwhile, has been shelled there in his limited sample.
Buckle up, folks, and don’t shy away from taking the over.
Zach Laing is the Nation Network’s news director and senior columnist. He can be followed on Twitter at @zjlaing, or reached by email at zach@oilersnation.com.
ARTICLE PRESENTED BY BETANO

Breaking News
- Blue Jays’ Scherzer, Sánchez starting rehab assignments this week
- July 20 Gameday: Dylan Cease takes the mound as Blue Jays open series with Tampa Bay
- Looking at 3 of the Blue Jays’ top players who are all struggling in 2026
- Former Blue Jay Nate Pearson DFA’d by Houston Astros
- Series Recap: Blue Jays lose another series, dropping two of three to White Sox